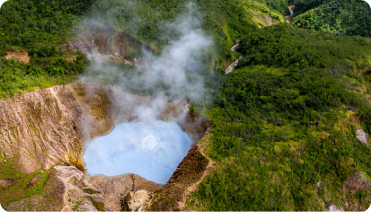
Statistics at a Glance Major Tourism Markets 2016 2017 2018 2019 2020* US 19,434 16,700 10,503 12,511 4,425 FWI 20,883 18,408 14,565 22,836 4,478 UK 5,043 4,825 3,713 5,155 1,488 Caribbean 17,961 16,926 22,360 31,838 5,958 France 4,960 5,918 3,750 7,423 2,006 Germany 2,073 1,912 1,376 1,960 780 Canada 3,096 2,803 1,841 2,320 929 Gross Domestic Product (Constant Prices) – EC$M) 2016 2017 2018 2019 2020* Sector Contribution to GDP by Economic Activity in in Constant Prices in Percentage (%) 1,026.16 955.56 928.92 1,005.83 864.47 Agriculture, Livestock & Forestry 12.95 11.28 8.26 9.35 11.21 Mining and Quarrying 1.01 1.03 2.11 1.79 0.91 Manufacturing 2.82 2.70 2.67 2.23 2.71 Hotel & Restaurant 1.77 1.77 1.32 1.43 0.63 Construction 5.34 5.46 11.14 9.49 4.80 Communication 5.72 5.68 6.38 5.59 6.43 GDP Growth Rate % (Market Prices) 2.76 -6.62 3.55 5.50 -16.60 Inflation Rate % – Base June 2010 0.72 (1.48) 3.98 0.14 (0.70) Exports EC$M 47.89 31.67 27.43 49.04 38.21 Imports EC$M 577.50 534.37 816.11 861.98 576.34 BOILING LAKE FORT SHIRLEY NATIONAL PARK MILTON FALLS BOILING LAKE FORT SHIRLEY NATIONAL PARK MILTON FALLS